Steps for Performing Illumination Correction in Microscopy Images
The Process of Illumination Correction on Microscopy Images
Hello again! 👋
It has been a little while since the last blog post! But, I am excited to be writing this new and updated blog post stemming from my first blog post ever on illumination correction (IC). I have grown and learned a lot in my first year of my position, from CellProfiler pipelines to multi-processing. After all the experience I have gained, I believe it is the right time to make an updated blog post on the fun concept of illumination correction!
Contents
Within this blog post, I will be going over:
- 🪜 Basic steps to illumination correction
- 💡 Overview on CellProfiler IC
- 🎙️ An updated opinion on IC methods
Note: Data used as examples are as follows:
- Sections 1 and 2: Illumination correction example from CellProfiler
- Section 3: Plate 1 data from the nf1_cellpainting_data repository
WAIT! ✋ Here is a quick recap:
What is illumination correction?
Illumination correction (IC) is the method of adjusting the lighting within a collection of images so that the lighting is evenly distributed across the image (no dim or bright spots).
This is an important step within an image-based analysis pipeline since the uneven illumination in an image impacts segmentation performance and accuracy of intensity measurements. Sometimes it is easy to see from the raw images that there is a need for illumination correction, but other times it might not be noticeable with the naked eye (Figure 1).
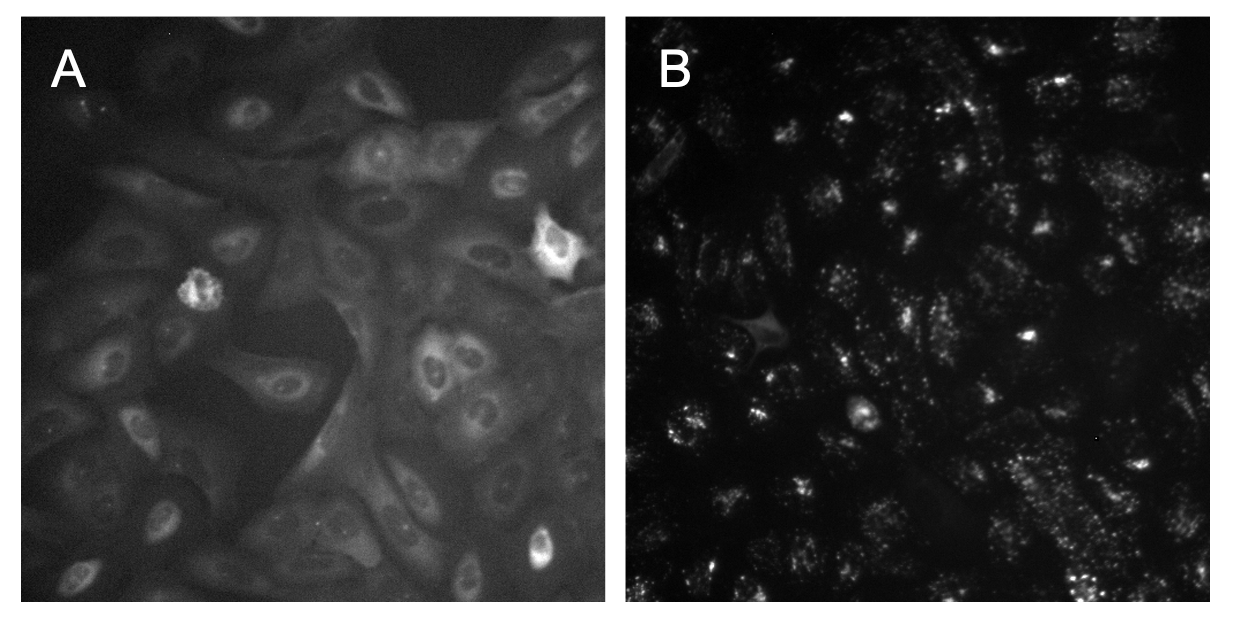
Figure 1. Variation in identifying uneven illumination. In image A, it is clear to see that the bottom right of the image is brighter and dims as it reaches the top left of the image. In image B, it is very hard to tell with the naked eye if there is any uneven illumination.
Basic steps to illumination correction
So, what do you do if you can not tell if your images need illumination correction or not? Lets talk about step 1!
Step 1: Brighten the image with Fiji
The easiest way to tell if there is uneven illumination in images that are dim or it is just not obvious is to increase the brightness to the point where you can see.
The software that I find to be the best at this (among many other things) is Fiji.
It is incredibly simple to use! All you have to do is:
- Open up Fiji
- Load in an image from your dataset
- Go to “Image -> Adjust -> Brightness/Contrast” (the shortcut on Mac and Linux is
Command + Shift + C) - Use the second bar to adjust the
maximumbrightness of the image and see what emerges
Once the image is brightened, either you will see the illumination across the image to be even (e.g., as you increase to max brightness, the image will become entirely white) OR you will start to see one part of the image to be more bright than the rest (Figure 2).
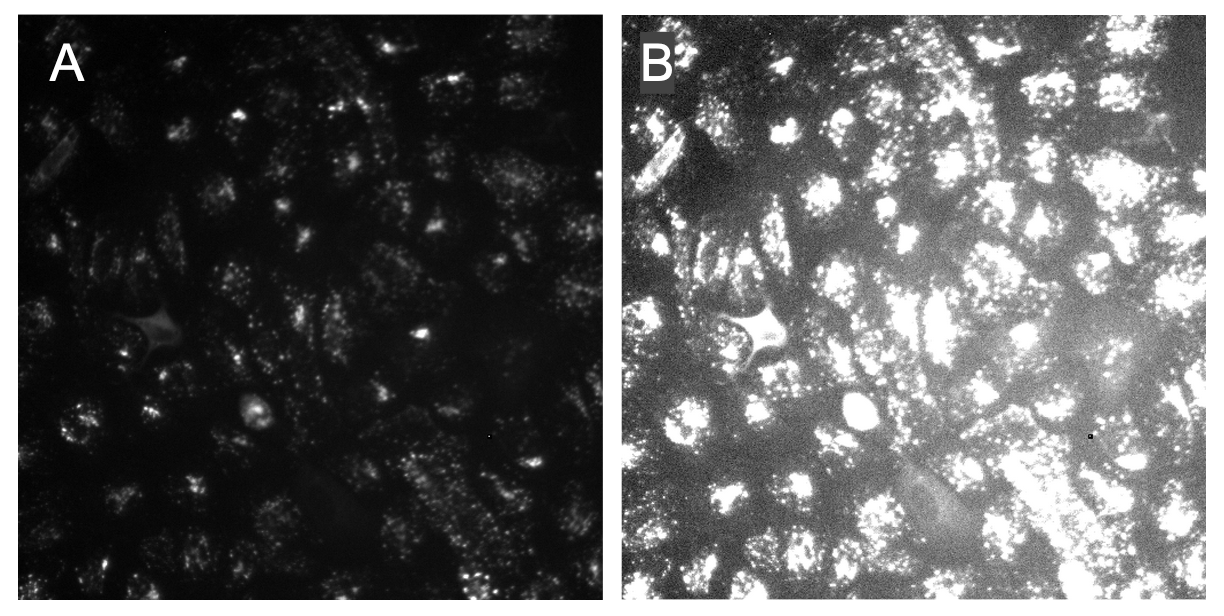
Figure 2. Increasing brightness improves ability to observe uneven illumination. Image A is the raw version of the image, where it is hard to tell if the image is suffering from uneven illumination. Image B is the brightened version of Image A, where it is much clearer to see that this image has a much brighter area in the lower right of the image.
Now that we have identified that our image definitely needs to be corrected for uneven illumination, we will need to create an illumination correction function. If you would like to go over how to make function in CellProfiler, please go to the next section of the blog post. This section goes over the basics, so lets move on to step two!
Step 2: Confirm that your IC function worked
Once you have performed the illumination correction method of your choosing, now you should probably confirm that it even worked!
Currently, there is no automatic or exact quantitative way to determine if the IC method worked on your dataset. You can probably use ChatGPT and it will tell you to measure the contrast of the image or standard deviation of the pixel intensities in the image, but I find this to be more tedious and does not always work.
The most full-proof method I have found is exactly what I have already told you! Brighten up the image and see how the illumination looks across the image. What you expect to see is that your IC corrected images will have even illumination across the image and no brighter areas (Figure 3).
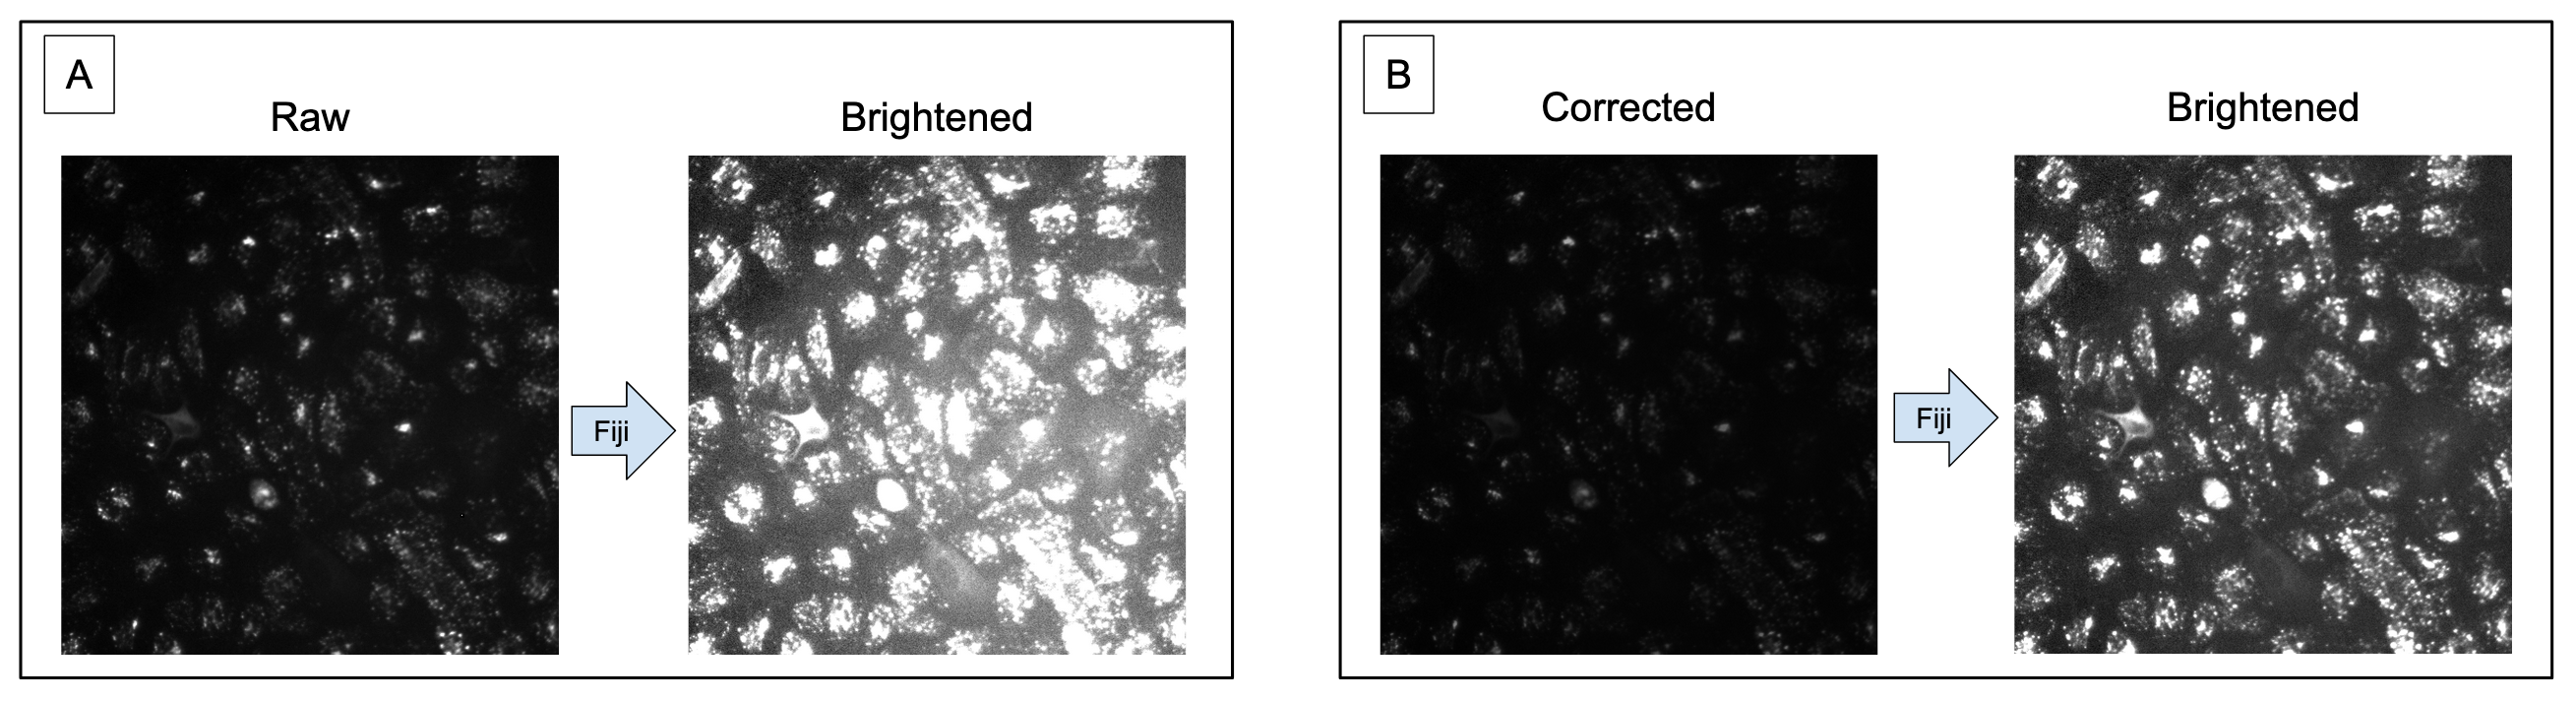
Figure 3. Illumination correction improves contrast and evens illumination. In panel A, it demonstrates how uneven the illumination is when brightened with the decreased contrast between the foreground (organelles) and the background. In panel B, the image raw image has been corrected and it is noticeable that the organelles are less intense. When brightened, it is more noticeable that the contrast is improved and the illumination across the image is even.
Step 3: Repeat for each channel
For all datasets you work with, these basic steps should be taken as quality control assurance prior to analysis.
Traditionally, an IC function is created for each channel, not all of the images in a dataset.
This is due to different distributions and sizes of the objects in a channel.
I have also noticed that patterns of uneven illumination tend to be channel specific.
If these steps are not performed and images are left with uneven illumination, you will likely have a hard time finding optimal segmentation parameters and the intensity measurements will not be biologically accurate.
NOW that you know the steps to determining if IC is needed and/or if an IC method worked, lets get into how to create an IC function through CellProfiler!
Creating a CellProfiler IC function
You might be thinking: “Well, you already said that you are using images from an already existing tutorial from CellProfiler, why do you need to create ANOTHER tutorial?”.
Well, good question! I have two main reasons:
- That tutorial is from 2011, when CellProfiler was in version 2.0. As of this blog post, the latest version of CellProfiler is v4.2.5, and MANY things have changed since then.
- The tutorial is more specific to the datasets they are using, and for me, I find it to be too narrow and doesn’t go into as much detail on the specific parameters as I would like.
Please note that I do not think that this tutorial is bad in anyway. My hope with this blog post is to make a more concise and broader version of this tutorial.
Now that the logistics are out of the way, lets get into making an IC function in CellProfiler!
CorrectIlluminationCalculate Module
The module to create the IC function is known as CorrectIlluminationCalculate.
This will create the function but will not apply it to the images.
To apply it to the images, you will use the second module in this duo, CorrectIlluminationApply, but we will get to that later.
BIG NOTE: You will need to have one module per channel (e.g., 3 channel = 3 modules).
There are A LOT of parameters in this module where for first time users like I myself was back a year ago, it can be pretty overwhelming. In this blog, I am going over the most basic steps and parameters that I have found I use or change from the default most often.
Step 1: Select a method for calculating the IC function
The first thing that you will need to decide when making a function is which method of calculating the function to use:
- Regular: Recommended per CellProfiler to use on a dataset where for majority of the objects in an image are evenly dispersed and covers most of the image (e.g., little background area). This method will create the function based on each pixel in an image.
- Background: Recommended per CellProfiler to use on a dataset where based on the images, the pattern of uneven illumination is the same between the background and objects. I personally have found that this can be hard to tell and it takes trial and error to find if this method works best on your dataset. This method finds the minimum pixel intensity in multiple “blocks” that set across the image.
When using the Regular method, make sure that Rescale the illumination function is turned on since this is a required parameter.
This is the opposite for the Background method.
Make sure that this same parameter is turned off, or it will cause this function to break and produce bad results.
The last parameter to note when using the Background method is the Block size parameter.
This parameter is specific to this method and you will set a pixel value.
This block, as referenced above, is placed multiple times to cover the image.
The value you should use is one where the block is most likely to have background and not objects.
I have found this takes trial and error to find the optimal value, but I recommend trying the default first.
Step 2: Determine how the selected IC function is calculated
There are three options here to choose from:
- Each: Calculate an IC function per image in a group of images (e.g., channel)
- All: Across Cycles: Calculate an IC function based on all images in a group which will finish during the last cycle, which means you can flag and remove images in the
FlagImagemodule. - All: First Cycle: Calculate the IC function based on all images in a group during the first cycle, which means that you will not be able to filter out any images.
Note: I will be completely honest here, I don’t really know what the big difference is between the All methods other than the ability to filter images. Calculating the function after the first or last cycle doesn’t seem like a big difference to me, but I could be wrong.
Depending on the pipeline, I normally use either Each or All: Across Cycles.
I normally use the Each method when I want to save all of my corrected images at the end of the pipeline, while I use All: Across Cycles when I want to save the IC function as an .npy file to use in the next downstream pipeline (e.g., segmentation and feature extraction).
Step 3: Pick the smoothing method
I won’t put down all of the different smoothing methods you can use here in this blog, or we would be here all day! Here is the link to the source code from CellProfiler that goes through the documentation for each method.
The method I typically choose for all of my IC pipelines is (drum roll please! 🥁): FIT POLYNOMIAL
Though it doesn’t sound very exciting, I assure you it is! This method I have found to be the most robust and produce pretty decent results. Though it isn’t perfect sometimes, I find this method to consistently improve the illumination in my various image sets compared to the other methods.
BUT… Take my advice with a grain of salt. I am only discussing what has been the method that consistently works the best for me with my data that contains different cell lines taken from different microscopes. This can definitely be different for your dataset, so I recommend playing around with this parameter as you are testing.
TESTING, TESTING, TESTING
Rinse and repeat the above steps with different parameters to see what sticks! I didn’t go over EVERY parameter that is offered in this module, so it is on you to determine what parameters are relevant to getting the best possible function.
CorrectIlluminationApply versus SaveImages module
Now that an illumination correction function has been created, you have two options:
- If you decided to use the Each method, then it would be best to apply the correction onto your images and save them in the same pipeline with the
CorrectIlluminationApplymodule. IMPORTANT: You will need to make sure the method for theSelect how the illumination function is appliedparameter matches the method from the previous module. To be exact, if you use applied the Regular method, you use Divide to apply the function. If you use Background, you use Subtract. - If you used an All method, the documentation from CellProfiler mentions that you can save the illumination function with the
SaveImagesmodule. I would highly recommend this when you are planning on correcting the images during the next pipeline and don’t want to have the intermediate files (e.g., corrected images). When saving the IC functions, make sure you are saving them asImagesin thenpyfile format (you can thank me later!).
And VIOLA! ✨
You now created your illumination correction pipeline in CellProfiler and you know exactly how to make sure that you made the best possible function for your dataset!
Feel free to checkout my GitHub profile and look into the image-based analysis repositories I am working on for examples of illumination correction pipelines I have made: jenna-tomkinson GitHub profile
Updated opinions on IC software
Now, I believe it is the right time to go back and reflect on my opinions regarding three different illumination correction methods I discussed in my first IC blog.
To refresh your memory, I went over these three software; CellProfiler, PyBaSiC, and CIDRE.
Note: I will not be including a section in the blog for CIDRE since it is still deprecated and can not be used. This means I have nothing new to add, but I will still say that maintaining and even creating software takes a lot of work, so kudos to all of the software and their respective developers I mention in this blog.
In this portion of the blog, I will be going over:
- CellProfiler
- BaSiCPy (formerly PyBaSiC)
- Comparison between methods
Now that we have established our topics, lets go into each of them one by one! As mentioned above, I will use the nf1_cellpainting_data repository for a comparison of the methods on the same dataset from .
CellProfiler
This section will be short, sweet, and to the point:
CellProfiler illumination correction has become my #1 go-to method! 🥇
My one main complaint from my first blog was that there were way too many parameters. This is a gripe I have with any software, as in my opinion, it becomes a big barrier for entry and makes it intimidating for unexperienced individuals to work with. Over time and lots of trial and error, I became much more confident, learning many different tips and tricks along the way. That is why my opinion has changed so much because I found when you know the most important parameters, it is the easiest method out of all three to test and determine the best function.
Along with making the function, being able to process images and correct them is the most streamlined and simple in CellProfiler.
Depending on the pipeline, all you need is a few modules and press the Analyze button.
As well, you have a ton of control over the output of the function or corrected images, and can insure the correct bit-depth, file format, etc.
CellProfiler is the standard in the image-based analysis field and will be hard to beat! 🥊 That is why I have dedicated an entire section to how you would make an IC function using CellProfiler and not any other method.
BaSiCPy (previously PyBaSiC)
This package has gone through many big changes, including the name! The difference was a bit jarring, as I ran into troubles when trying to implement the same code I had using for the previous version.
When attempting to test with this method in January, I struggled to get the process to work on even one image (see issue #120 which is closed). Now, 7 months later as I am writing this blog, I decided to go back and see if I could figure out what I did wrong. Well, firstly, I now realized that all I needed was to turn my directory of images into a list of numpy arrays (silly me! 😜). There seems to be no current way to only run on one image (also noted in issue #104), which is fine, but good to keep in mind. Now with my new and improved skills compared to me 7 months ago, I decided to take another crack at BaSiCPy in Python.
Note: To be specific, this was the code that I used to create IC function with BaSiCPy (based off of the WSI_brain example notebook):
# set the function, removed smoothness_flatfield=1 which is default
basic = BaSiC(get_darkfield=True)
basic.fit(images)

# correct the images
images_transformed = basic.transform(images)
Good news! I was able to get it to work! 🎉 But…
I want to make clear something very important.
Make sure that you are using the recommended function from BaSiCPy to save the images, which is skimage.io.imsave.
At first, I attempted to use the pillow package to convert the images from numpy arrays and save the images with the Image.save function.
I will admit, this was something that ChatGPT recommended for saving images from numpy arrays.
What occurred was VERY interesting.
Some images showed black/empty spots which I call “artifacts” (Figure 4).
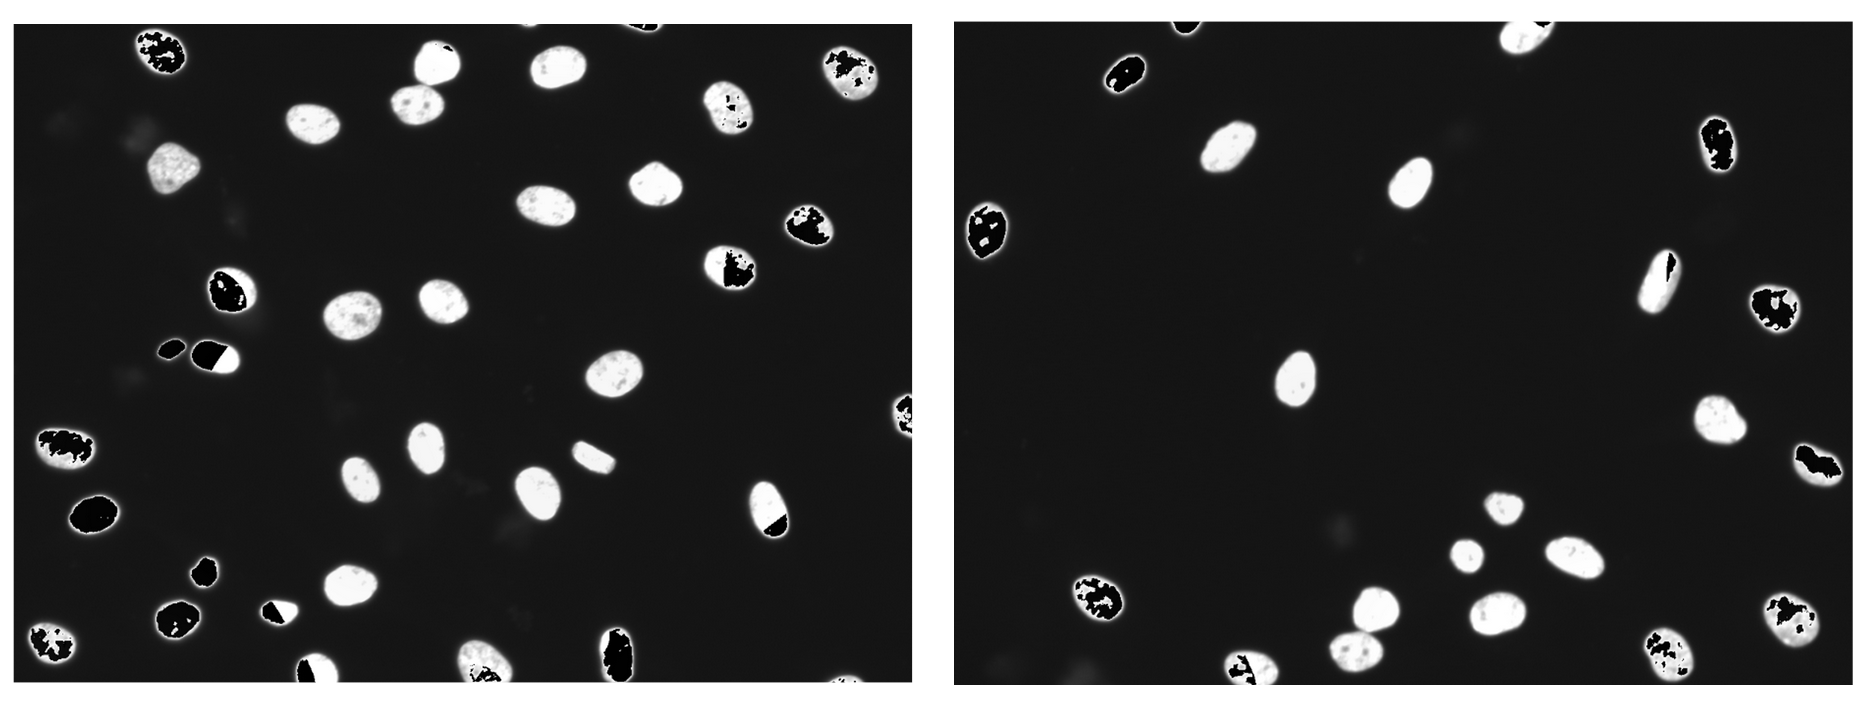
Figure 4. Artifacts produced when using the pillow package to save images. Compared to other images with different organelles, these artifacts are disproportionately produced in the nuclei channel. As well, the artifacts become more intense in images where organelles were highly saturated.
After this issue, I decided to take a look back at how I had saved the images when using the older version of BaSiCPy (see notebook from old repository here).
I had in fact used the skimage package to save the images, but I had converted the images to 8-bit which was different from the original images bit-depth for that dataset (which was 16-bit).
I found out this was due my oversight when implementing the code from another repository that this conversion occurring was a different bit-depth than my original images (see the issue I created and recently updated).
Though embarrassing, I am realizing that I had to make this mistake to be able to learn and greater appreciate the small details of code and working with images.
Now going back and having more knowledge under my belt, I was able to identify this problem and implement the correct conversion to 16-bit.
Comparing the same images when using the different saving methods, I can say that using skimage.io.save was a success (Figure 5)!
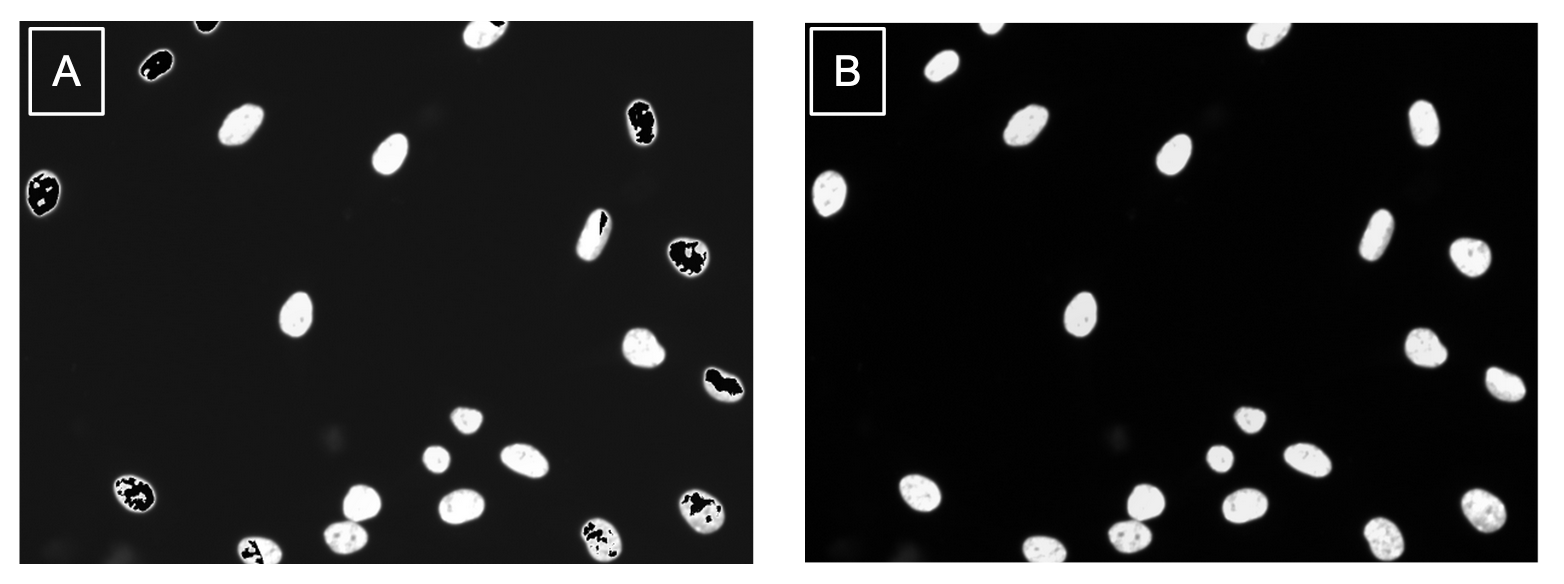
Figure 5. Method of output impacts quality of images. (a) This corrected image was saved using the PIL Image function which caused issues in the image like the black artifacts in the nuclei. (b) This corrected image was saved using the recommended scikit-image package and the results are free from artifacts.
You might wonder: “Well, why even need to convert in the first place?”
Great question! If you don’t convert and just save the corrected image straight from BaSiCPy, your image will be a 32-bit image. Now, I am not an expert in bit-depth at all. From what I understand, having higher bit-depth means more information preserved in the image. But, I am not sure how more information would be added into a image that was a lower bit-depth to begin with. So, in my opinion, it makes sense to convert the corrected images back to the original bit-depth to preserve the same amount of information that was originally collected.
Since one of my biggest issues was that an output method wasn’t added into the BaSiCPy repository example notebooksthat are linked in the main README, I decided to contribute with my first PR for the repo! I implemented the code I had to output corrected images into all the notebook and included extra notes to make the process of using BaSiCPy more interpretable. My hope is that this will make it much easier for someone new to this package to be able to quickly use it without going through all the troubles I did.
So, moment of truth… Will I end up including this in my pipelines over CellProfiler?
My answer is unfortunately no at this time.
I have identified a few limitations that influenced why I am not going to use it over CellProfiler for my traditional image-based analysis projects:
- It is not optimal for running with multiple channels. A way around this could be to utilize a Python package called papermill, which allows for running one notebook with different variables through an
shfile (here is an example showing how this is done with two different variables). - There isn’t a way to run multiple plates a time (e.g., parallel) with this method, unlike compared to CellProfiler (wink, wink; will talk about in the next blog 😉). Being able to run multiple plates at once decreases the computational time, which can be important for some projects.
BUT! I haven’t had a project that included time lapse data, so I will definitely be taking on the challenges I mentioned above with the time comes.
Side note
This method of illumination correction is not just a Python package. This has been implemented as plugins for:
- ImageJ/Fiji: https://github.com/marrlab/BaSiC
- Napari: https://github.com/peng-lab/napari-basicpy
I have not been able to test either of these plugins.
Firstly, I have not tested the ImageJ plugin due to seeing that as of last month in an issue, one of the developers stated this plugin is no longer maintained.
The issue references that there is no command for BaSiC, which is one of the big functionality changes made in the recent update.
Since this plugin has been around for a while, it likely means that it has not been updated to use the new version of BaSiCPy.
Lastly, I have not tested with the napari plugin as was planning on testing with this new software on my MacBook, which uses a M2 Pro chip.
If you don’t know, the M1 and M2 chips come with MANY issues when trying to use some software packages due to lack of support.
Unfortunately, this is more of an Apple issue it seems than a developer issue, so I just don’t currently have the bandwidth to try and test out the software and plugin on my Linux machine (the powerhouse of a computer the lab calls fig 🍃).
Comparison of methods
Though I have already stated that I will be used CellProfiler over BaSiCPy for usability reasons, I wanted to include a direct comparison of the quality of correction from both methods (Figure 6).
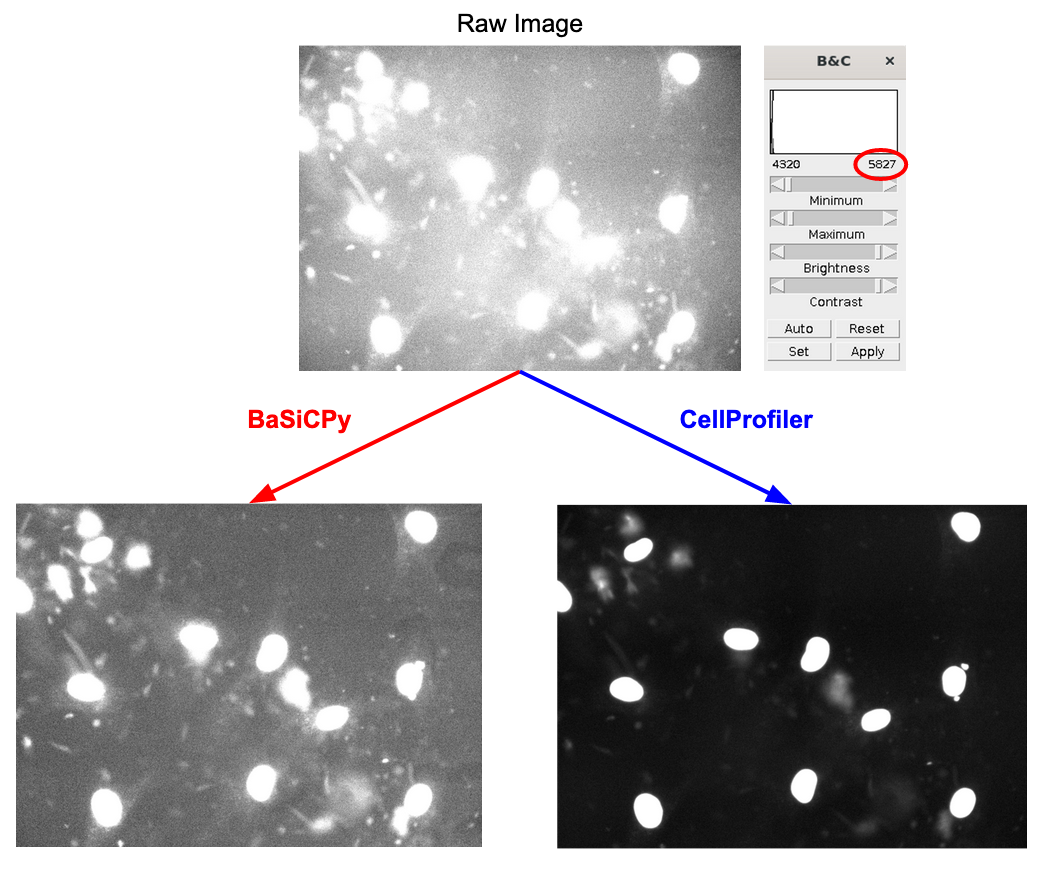
Figure 6. Comparing quality of illumination correction between methods. All images are brightened to approximately the same level as seen in the value in the red circle (+/- 50 units). The corrected image from BaSiCPy looks to have made the illumination more even by correcting the bright spot in the middle of the raw image, but did not improve the contrast between the foreground and background. CellProfiler is able to both even out the illumination across the image and significantly improve the contrast.
I can say that without a doubt that CellProfiler (with optimal parameters found through trial and error) is able to significantly outperform PyBaSiC. The most significant difference is with the contrast, which is important to improve segmentation as low contrast can cause issues with any segmentation software to identify organelles in the foreground versus the background.
Conclusion
The main takeaway that I hope that all readers can take from this blog is that illumination correction is a skill and it takes time to get used to the process. As well, it is important to know all the tools 🛠️ at your disposal to choose what is the best method for your dataset.
I really hope that this blog will help make the process of illumination correction easier, even if it is just for one person. I know I would have benefited from something like this when I first started. I think the past version of myself would approve of this, if I do say so myself! 🤗